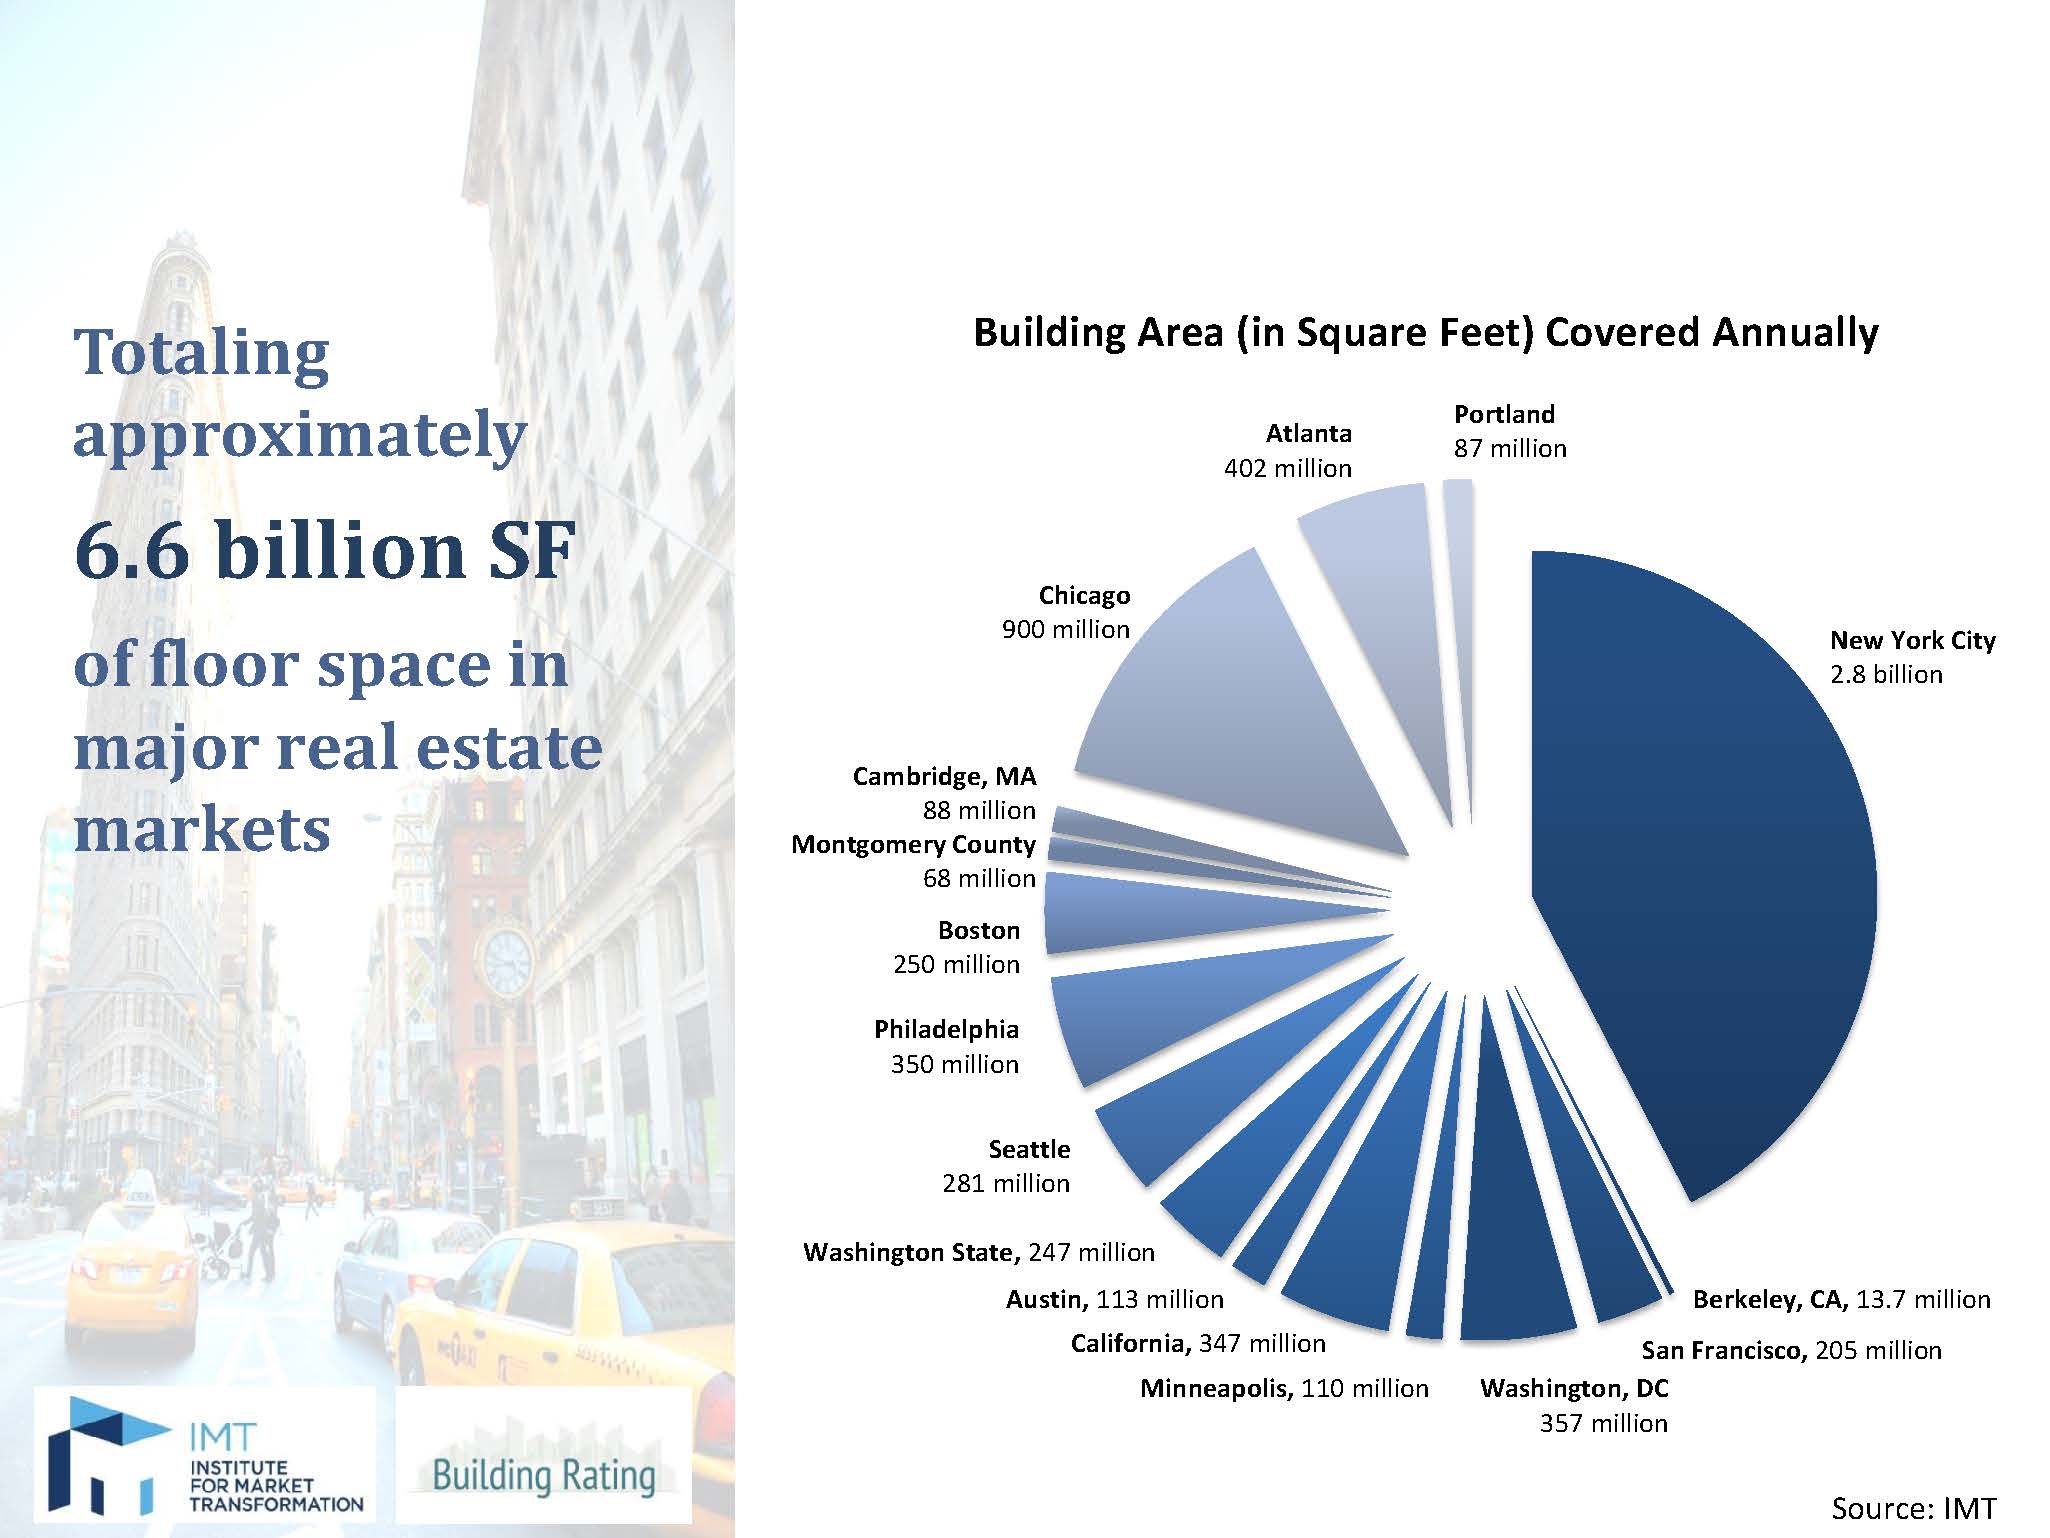
Download IMT_SF Covered_IMAGE_05062015.jpg (185.63 KB) Download IMT_SF Covered_IMAGE_05062015.pdf (432.44 KB)This pie chart shows the gross building area covered annually by benchmarking policies across U.S. jurisdictions.